Article
Executive Summary
The Canadian Bankers Association (CBA) and its members recognize that small and medium‑sized enterprises (SMEs) are a critical pillar of the Canadian economy, representing the vast majority of businesses nationwide and employing the majority of the private‑sector workforce.
SMEs are well served by the important role banks play in providing financing. Across Canada, banks compete aggressively with one another, and with non‑bank financial institutions and companies, some with a regional focus, to deliver financing and other services to personal and business customers, including SMEs. Banks tailor financing and non‑financing solutions to meet the diverse needs of the highly heterogeneous range of SMEs. Banks’ ability to deliver a comprehensive suite of products and services, supported by diverse funding sources, technological innovation, and trust, provide a source of growth and stability for SMEs enabling long‑term partnerships between SMEs and their banks.
When providing financing to SMEs, including through amortizing term loans1, banks undertake due diligence to assess the business and its management’s character, capacity, capital, conditions and collateral. As part of this due diligence, banks increasingly employ technology to automate the process and leverage data. They also leverage government guarantee programs, personal guarantees and other types of collateral to reduce risk. This approach has enabled banks to increase their authorized, outstanding and unused debt available to SMEs since the global financial crisis. Similarly, banks have provided the foundation for growth in disbursement of amortizing term debt for SMEs over the same period of time.
As a result, SMEs have ample access to debt financing from banks, including amortizing term loans. Indeed, in Statistics Canada surveys, SMEs have consistently ranked non‑financing factors ahead of obtaining finance as a primary obstacle to growth. Bank loan applications are not seen by SMEs as a barrier to financing, and approval rates for both debt financing, generally, and amortizing debt financing, specifically, are high. Furthermore, banks typically price financing, including amortizing term loans, based on the risk assessment of the SME as well as the structure of the transaction (e.g. collateral, loan‑to‑value, guarantees, reporting, etc). Newly established SMEs may face higher interest rates due to a lack of historical sustainable cash flow in comparison to more mature and established SMEs.
The CBA makes several recommendations to help remove friction for SMEs and increase competition in the financial services marketplace. They are:
- Easing the burdens for entry of institutions into the banking system without compromising stability of the banking system and its participants nor consumer protection
- Respecting the principle of proportionality for small- and medium‑sized banks
- Implementing changes to bank capital adequacy frameworks that enable the deployment of more capital
- Incorporating growth considerations into the regulatory decision‑making process
- Streamlining and improving government guarantee programs, notably the Canada Small Business Financing Program (CSBFP)
- Expanding data sharing policy to include government entities such as the Canada Revenue Agency (CRA)
Introduction
The Canadian Bankers Association (CBA) is the voice of more than 60 domestic and foreign banks operating in Canada with over 280,000 employees that help support Canada’s economic growth and prosperity. The CBA advocates for public policies that promote a sound, secure, and competitive banking system.
Beyond serving as the safe and trusted cornerstone of Canada’s strong financial system, banks work closely with customers to help them achieve their goals; whether purchasing a home, starting a business, saving for the future, or navigating periods of financial uncertainty. In 2024, banks contributed approximately $74 billion (or nearly 4 percent) to Canada’s GDP, paid close to $16 billion in taxes to all levels of government, and provided $29 billion in dividend income to Canadian seniors, families, pension plans, charities, and endowments. The banking sector operates a network of over 5,400 branches and nearly 18,500 automated banking machines (ABMs), delivering accessible, affordable, and competitive banking services across Canada.
Canada’s banking sector is well‑managed and well‑regulated, and banks operating in Canada are consistently recognized as among the safest in the world. Banks in Canada provide affordable choice with innovative, reliable and accessible products and services. Their stability has been demonstrated during both long‑term economic cycles and periods of crisis. During the COVID‑19 pandemic, Canadian banks provided significant relief to Canadians and worked closely with the federal government through its Business Credit Availability Program (BCAP) to deliver Canada Emergency Business Account (CEBA) loans to nearly 900,000 SMEs, and to distribute emergency benefit payments quickly and securely to Canadians in need. Banks were able to achieve this broad, nationwide outreach through trusted digital channels.
Canadian banks recognize the critical role of small and medium‑sized businesses to the Canadian economy and the importance of financing their needs and growth. The CBA welcomes the opportunity to participate in the Competition Bureau’s study and to provide comments on behalf of its members. This submission outlines the competitive intensity of Canada’s financial marketplace with specific attention to SME debt financing and, in particular, amortizing term loans. The CBA also offers responses to the consultation questions and recommendations.
Banking and the broader financial system are highly competitive
The financial services sector in Canada is characterized by intense competition driven by technological advancements, diverse market players, and evolving personal and business customer preferences. Advancements in technological innovations have facilitated market entry and scalability for banks, non‑bank financial institutions and lenders and, increasingly, non‑financial firms, which has intensified competition within the financial sector. These factors have reshaped the financial experiences of personal and business customers (including SMEs), offering enhanced accessibility, improved customer experience, and streamlined financial interactions. Ultimately these technological innovations increase competitive intensity and contestability for personal and business customers.
Banks compete aggressively with one another
Canada’s banking sector is the cornerstone of the financial sector. Personal and business banking customers rely on banks because of their safety and soundness, as well as convenience and service. The sector has 78 federally regulated banks and credit unions that compete for banking products and services against each other across the country, as well as with other financial services companies.
Banks can be categorized as follows:
- Six domestic systemically important banks (DSIBs) operating coast‑to‑coast across all products and services
- 26 small and mid‑sized domestic banks focused on specific regions or specialized products and services
- 15 foreign banks subsidiaries and 28 foreign bank branches offering targeted financial products and services to Canadian households and businesses
- Three federal credit unions providing a suite of financial products and services to specific regions
Banks’ capital is highly regulated and influences lending
Banks face more intensive regulatory scrutiny than other lenders or financial services companies. In particular, because banks have the ability to accept, and the responsibility to safeguard, personal and business deposits, they are required to hold sufficient, high‑quality capital to protect depositors under the federal prudential regulatory framework. Regulatory capital requirements, such as ratios of capital to deposits and other debt, including leverage and risk‑based capital ratios, influence the amount of capital banks can hold relative to their liabilities and thereby impacts the amount, type and cost of lending banks can undertake.
Banks fund their lending activities through debt and equity. Debt, typically in the form of deposits and corporate debt offerings, is external financing and considered a liability that must be repaid either on demand or upon maturity. By contrast, equity (also known as capital in this case) is permanent funding that has been invested into the bank requiring no repayment. While equity is the more stable form of funding, it is also more costly. Unlike debt, it does not involve contractual payments such as interest and principal, and returns to equity holders are uncertain and contingent on performance. Furthermore, because equity holders are the first to absorb losses, therefore facing greater risk than debt holders, they require a higher expected return on their invested equity.
All banks in Canada must be prudentially regulated by the Office of the Superintendent of Financial Institutions (OSFI).2 An important aspect of its mandate is to ensure banks and other financial institutions remain in a safe and sound financial condition. In exercising this mandate, OSFI strives to protect the rights and interests of depositors, among others, while having due regard for the need to allow banks to compete effectively and take reasonable risks. OSFI does this by setting minimum authorized leverage ratio requirements per its Leverage Requirements Guideline, with the leverage ratio serving as a backstop to OSFI’s risk‑based capital requirements. OSFI’s target minimum risk‑based capital ratios are specified in its Capital Adequacy Requirements (CAR) Guideline. A leverage ratio measures a banks’ capital with its total assets while risk-based capital ratios measure risk‑weighted assets with its capital.
In general, there are two methods of calculating a bank’s risk‑weighted assets for risk‑based capital ratios:
- The Advanced Internal Ratings‑Based (AIRB) approach - Banks are allowed to use OSFI‑approved internal models to calculate capital requirements for credit risk, leveraging internal estimates for probability of default, loss given default, exposure at default, and maturity. These internal models are based on sophisticated risk modelling including long data history, strong governance and ongoing validation and audits
- The Standardized Approach (SA) – OSFI mandates specific risk weights for different asset classes based on standardized criteria, such as credit ratings. This approach is less risk‑sensitive and has lower complexity
At present, only the DSIBs are authorized by OSFI to use the AIRB approach. All remaining banks utilize the SA approach for capital adequacy. The primary benefits of the AIRB approach is to provide more precise, risk‑sensitive capital, improved risk management, and potential capital relief compared to simpler, standardized methods.
The level and ratio at which capital must be held as well as the calculation of risk weighted assets impacts the cost of funds which then has downstream impacts on the amount, type and cost of lending to personal, commercial and corporate customers due to the higher cost of capital relative to deposits and debt instruments.
Banking concentration consistent with other countries and not determinative of competitive intensity
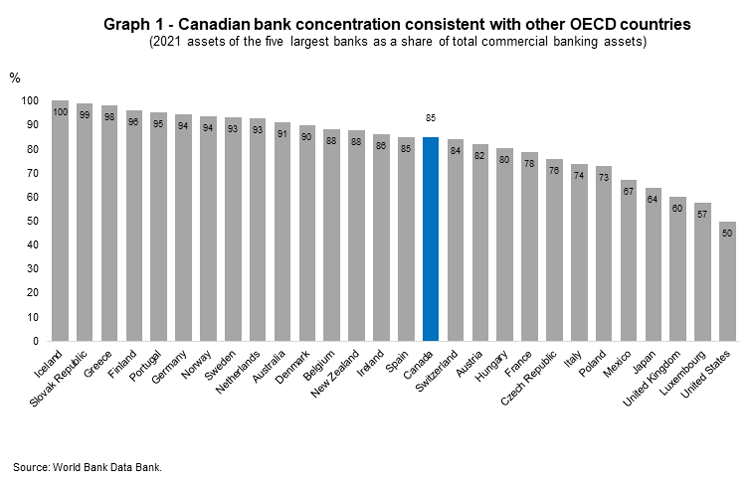
According to the World Bank Data Bank, the five largest banks in Canada account for 85 per cent of commercial bank assets in Canada in 2021 (Graph 1).3 This level of concentration of banking assets is not unusual among industrialized countries. This ranks the Canadian banking system in the middle of the Organisation for Economic Co‑operation and Development (OECD) economies in terms of concentration with ten countries having rates of concentration of over 90 per cent, including Germany, Australia and New Zealand. Furthermore, the OECD has emphasized that market concentration should not be confused with market power or competitive intensity, which is what matters for personal and business customers. While concentration can be an indicator of market power, it is far from determinative. Market share within the banking sector says very little about financial services that are provided by non‑banks offering substitutable products and services within a jurisdiction, which is particularly true for Canada.4 While the World Bank focuses on commercial banking assets, in the Canadian context, it neglects provincially‑regulated deposit‑taking institutions which form an important subset of non‑banks offering substitutable financial products and services.
Banks compete against non‑bank financial institutions and financial services companies
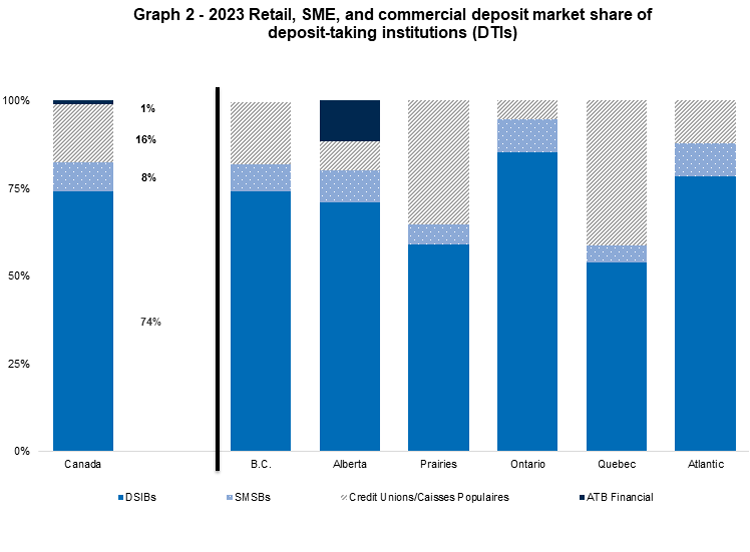
There are many provincially‑regulated deposit taking institutions which form an important subset of non‑banks offering substitutable products and services to banks and which are not part of the World Bank data. Nearly 200 provincial credit unions and caisses populaires, as well as ATB Financial, a Crown corporation
wholly‑owned by the Government of Alberta, provide services to personal and business customers in Canada. When these institutions are considered, the adjusted concentration level in the deposit taking market declines considerably, particularly in western Canada and Quebec (Graph 2).
Beyond provincially‑regulated deposit‑taking competitors, banks compete with a range of other lenders including (i) government‑owned financial companies such as the Business Development Bank of Canada (BDC), Farm Credit Canada (FCC) and Agriculture Financial Services Corporation (AFSC), (ii) trust and loan companies, (iii) machinery and equipment financing companies, (iv) monoline and specialty lenders, (v) mortgage investment corporations, (vi) private lenders, and (vii) fintech lenders. In comparison to banks and other deposit‑taking institutions, these competitors do not collect deposits as a form of funding and are consequently not subject to OSFI’s prudential regulatory requirements faced by banks. They also have different sources, levels and ratios of debt and equity funding as well as origination and business strategies. For instance, machine and equipment financing companies as well as monoline and specialty lenders tend to utilize equipment vendors and dealers, finance brokers, captive finance arms and direct sales teams to originate loans.
Furthermore, the financial services sector is transforming from physical to digital, which has attracted entry by new types of financial sector fintech firms such as payment services providers, buy‑now‑pay‑later companies, digital currency exchanges, robo‑advisors, and other lenders with business models that were never contemplated when most of Canada’s financial sector legislative architecture was designed. According to Tracxn, there are more than 5,600 fintech startups competing in the Canadian financial services marketplace.5 Some of these fintechs provide small business financing via a revolving small business loan while others issue credit cards (e.g., some fintechs issue prepaid credit cards which are directly funded through business account balances).
Furthermore, large multinational technology companies with strong brand presence are well positioned to expand into the Canadian financial services marketplace. These global technology giants have unparalleled access to customer data, enabling them to offer products and services to personal and business customers from coast to coast without the need for a physical presence. Competitive intensity has increased considerably due to digitalization in the financial services sector, and new entrants no longer need to establish networks of brick‑and‑mortar branches or offices to serve personal and business customers. Instead, they rely on telecommunications hardware and payment networks to reach most Canadians on apps and websites. Furthermore, personal and business customers’ preferences and behaviours are being influenced by growing access to real- and any‑time information, alongside the use of a growing and diverse range of digitally‑connected devices (smartphones, watches, tablets, and personal computers) and rising technology proficiency. The combination of maturing digital technology, steady growth and adoption of e‑commerce, strong investment climate for innovative business models and changing customer preferences and behaviours has fostered the growth of new players.
To remain competitive, banks must be leaders in developing and adopting new technologies that respond to evolving personal and business preferences and behaviours, delivering more personalized, accessible, and seamless banking experiences. For example, five Canadian banks rank in the top 30 banks worldwide in the adoption of artificial intelligence (AI).6 Technology is increasingly used to support simple and routine self‑serve financial transactions allowing employees to focus on providing higher‑value advice and tailored and customized solutions for personal and business customers.
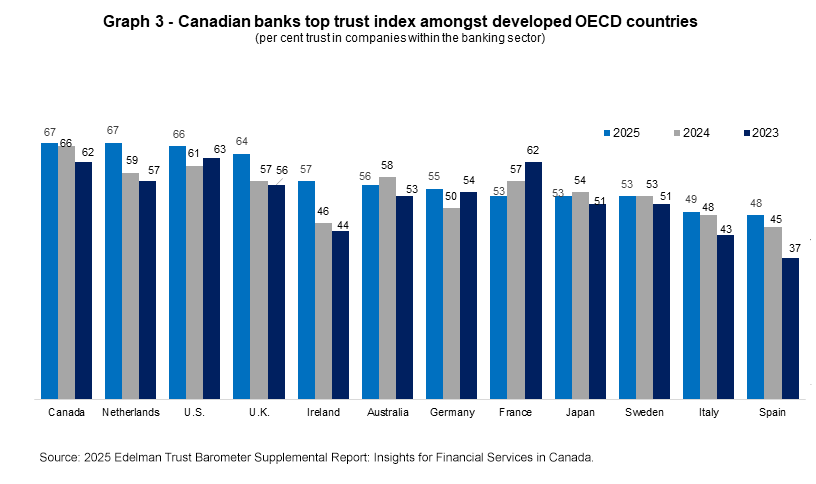
As Canadian banks move to incorporate more technology into how they serve personal and business customers, they continue to understand that they also must continue to maintain customers’ trust as they have always done. Indeed, Canadian banks have increased trust with the public over the past three years and, relative to banks of other developed countries, Canadian banks lead in trust with the public.7
SMEs well served by banks’ role in financing
SMEs are a critical pillar of the Canadian economy, representing the vast majority of businesses nationwide. SMEs are also highly heterogeneous – ranging from sole proprietorships to several hundred person corporations; from mom‑and‑pop shops to start‑ups and fast growing firms; from firms selling to local communities to those trading with export markets; and from farming and retail to information technology and knowledge‑based sectors. As a result of this heterogeneity, banks must tailor financing solutions and use technological innovations to attract, serve and retain these SME customers.
While the focus of this market study is on amortizing term loans, banks provide different types of financing to SMEs based on their needs, including commercial mortgages, leasing, revolving lines of credit, overdraft, credit cards, as well as amortized term loans. Banks also offer a wide range of non‑credit services, including business chequing and savings accounts (in both Canadian and foreign dollar denominations), payments solutions, investments, insurance, and advisory services. This full suite of products and services means that SMEs build relationships with their bank over time, sometimes decades. Banks’ full suite of products and services as well as diverse funding sources, reputation for technological innovation, tailored advice and trust are sources of growth and stability for SMEs, enabling those relationships to build.
The typical features of banks’ SME amortizing term loans include:
- Amortization - The time it takes to pay a loan. It is typically based upon the useful life of the asset financed, and could be as long as 30 years
- Term - The length of time a loan contract is in effect, typically one to five years (shorter for working capital; longer for fixed assets). It may or may not be aligned to the amortization period. At the maturity of the term a loan is due and payable and, if not fully amortized, the residual outstanding amount is most often renegotiated
- Loan amounts - The amount that is borrowed. Often referred to as the "principal". Typically starting at $10,000
- Payment structure - The type of payment structure that is used, typically regular payments (typically monthly8) including principal and interest
- Interest rates - Fixed or floating rates of interest, and aligned to the risk tolerance of the borrower and the transaction
- Prepayment rights - Vary by lender and loan type
- Fixed rate loans can be priced and structured to permit the option for small annual prepayment amounts
- Floating rate loans are typically open to prepayment with no breakage fees9
- Collateral or guarantor requirements - Borrowers typically provide collateral or a guarantor10 to mitigate default risk
Banks apply due diligence and technology to adjudicate credit for SMEs
When providing financing to SMEs, including amortizing term debt financing, banks must undertake necessary and appropriate levels of due diligence. Banks are increasingly using technology to improve overall client digital experiences and onboarding. For example, technology has enabled banks to provide account managers with personal AI‑based support tools to assist clients and help streamline the application and approval process. Banks undertake their due diligence when adjudicating SME amortized term loans through a combination of traditional, relationship‑based underwriting and increasingly automated, data‑driven systems. While manual review by credit officers is common for complex or large loans, many banks use AI‑driven, automated platforms to proactively pre‑screen applications, identify credit needs, provide advice and enable quicker decisions for smaller loan amounts. Banks are continuing to invest in platform enhancements and utilizing AI to leverage data to automate and enhance the effectiveness of the credit adjudication decisioning process and accelerate response (including with pre‑approved offers) and fulfilment times. Banks are investing in their lending application and automating the decisioning process with AI, versus a person that would manually have to review documents and calculate whether the client qualifies for lending.
Regardless of whether the process is manual or automated, amortized term loans for SMEs are adjudicated applying credit risk assessment criteria involving the five Cs of credit. They are:
- Character – The credit history, credibility and reputation for repaying debt11
- Capacity – The ability to pay back the agreed‑upon schedule of amortized term loan payments by evaluating cash flow and financial health
- Capital – The equity that the business owner(s) have invested in the business borrower
- Conditions – The requirements that are expected to be satisfied before funds are advanced as well as covenants (financial or otherwise to monitor the financial health of the business)
- Collateral – The assets that are pledged to the lender to secure an amortized term loan that can be sold or leveraged in order to recover debts owing if a business cannot repay the loan. Personal guarantees fall into this category
The primary purpose of taking a personal guarantee is to align a business owner’s interests and behaviour with their bank which is consistent with OSFI Capital Adequacy Requirement (CAR) Guidelines.12 Guarantees are used to reduce credit risk and are particularly helpful when "hard security" is not available or is limited. A personal guarantee can ultimately serve to enable more SME lending, partly by strengthening weak collateral and capitalization and, improve credit recovery outcomes. Risks impacting this creditworthiness, absent a personal guarantee, include traditional credit considerations and fraud.
Given the heterogeneity of the SME market, banks’ application of personal guarantees vary considerably. As a matter of law, sole proprietors or general partners are personally liable for the debts of the business. Additionally, for a less established SME without its own business track record, the personal creditworthiness and history of an individual owner may provide support for an amortizing term loan that may otherwise not have been available to the business. Since SMEs often lack elements of third‑party assurance (e.g. audit) or formal governance, personal guarantees serve to align the incentives of the owner‑operator to that of the business and may improve the SMEs access to or cost of credit and/or reduce indirect costs such as audit costs. If an SME is incorporated and the amortized term loan is secured by an individual’s property then the personal guarantee is a legal requirement to perfect such pledged security. An additional consideration is that an amortized term loan supported by personal guarantees may be more tax efficient for borrowers and the business than an owner’s equity or other alternatives.
While personal guarantees are recognized as a form of credit risk mitigation subject to certain requirements in the CAR Guideline, intellectual property is not similarly recognized. This is unfortunate as the innovation economy is increasingly driven by intangible assets such as patents, data, software, trademarks, and proprietary technologies. Yet the current prudential framework applicable to banks treats intangible collateral as high risk, which materially restricts SME access to competitive financing and limits Canada’s ability to scale innovative firms based on intellectual property. A World Intellectual Property Organization (WIPO) Canada Country Report highlights that "investments in intangible capital are significant, reflecting the importance placed on fostering innovation and growth through IP" and confirms that intangible assets now play a central role in the value creation of Canadian enterprises.13 Banks therefore face capital regulatory constraints when lending against IP, with limited relief even under advanced internal models. This makes IP backed amortized term loans capital intensive and economically uncompetitive, suppressing financing for innovation driven SMEs.
Based on the five Cs of credit criteria, the SME application is then risk graded by models to assess the creditworthiness of borrowers. The amortizing term loan structure including interest rate, security and covenants is reflective of the risk assessment. Beyond the adjudication of the amortized term loan, a risk appetite provides criteria for stress testing to evaluate the impact of adverse economic scenarios on the credit portfolio, risk limits and overall portfolio concentrations, monitoring, reporting, review and update requirements to ensure response to changes in market conditions, regulatory requirements or the banks’ risk profile.
Banks have increased the supply of SME debt
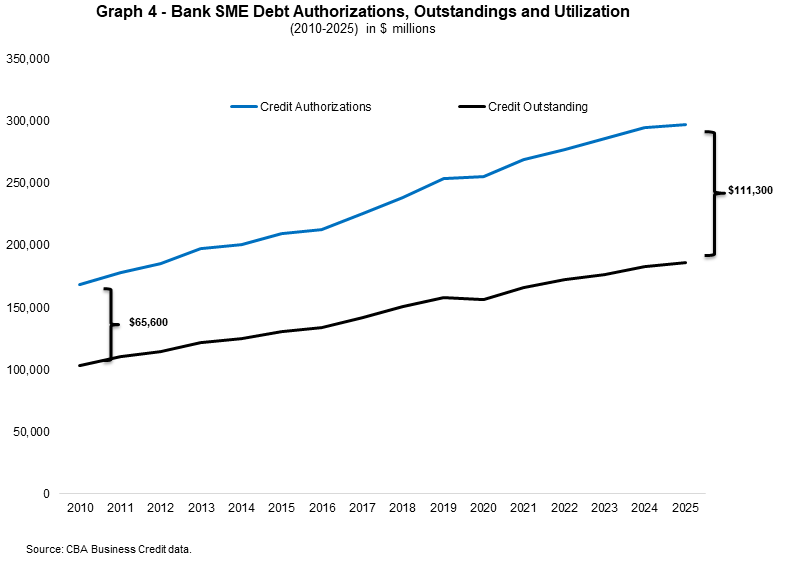
By combining this due diligence with the application of technology and innovation, banks have been able to increase the supply of SME debt, including amortizing term debt. Banks have increased their debt authorized to SMEs from $168.9 billion in 2010 to $297.8 billion in 2025 – a 76 percent increase. Over the same period, bank debt outstanding to SMEs increased from $103.3 billion to $186.5 billion – an 80 percent increase. As a result, unused debt available to SMEs has increased from $65.6 billion to $111.3 billion (Graph 4). This credit includes both revolving and amortizing term debt.
Macroeconomic factors influence supply of amortizing term loans to SMEs
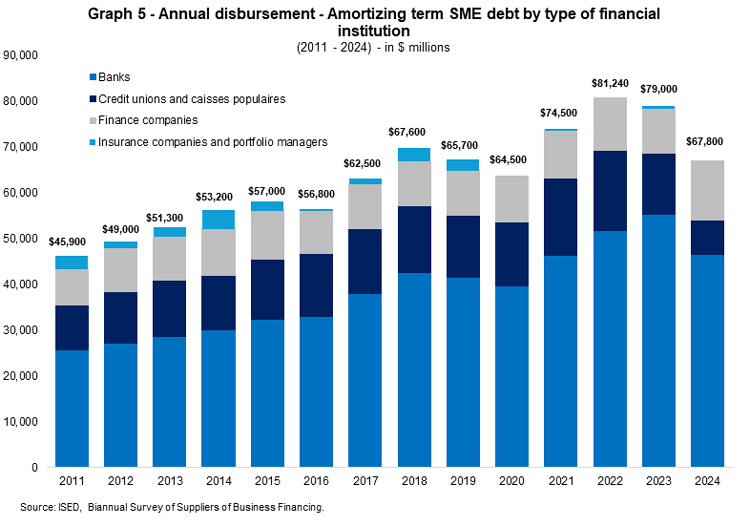
The supply of amortizing term loans for SMEs has increased since the global financial crisis. In 2011, $45.9 billion in amortizing term loans were disbursed by financial institutions. Banks supplied about 56 percent of this debt. By 2022, this figure increased to $81.2 billion – a 77 percent increase over 11 years. This was driven by banks who saw their amortizing term loans disbursed to SMEs increase by 115 percent with a share of the amortizing term loan market of about 64 percent. Since 2023, total amortizing term SME loans disbursed declined slightly to $79 billion and more so in 2024 to $67.8 billion (Graph 5). According to the Bank of Canada’s Business Outlook Survey, firms were concerned about weak consumer spending and generally soft demand, uncertainty about economic conditions, taxes and regulations in 2024.14 With reported data for just the first half of 2025, amortizing term debt financing is expected to rebound and surpass 2024 levels due to improved business sentiment and investment intentions.15
Role of government loan guarantee programs
Banks work in partnership with the federal government to implement loan guarantee programs to help strengthen an SME customer’s credit application. There are several government guarantee programs that banks can leverage to assist their customers, highly dependent on the type of SME and circumstance.16 These programs have been implemented by the government to target a particular public policy area or objective. They differ in terms of program parameters such as mandate, administrator, eligible businesses, strength of government guarantee, loan‑to‑value (LTV), maximum loan limit, asset covered, repayment terms, interest rate, fees, etc. While banks perform their usual due diligence, the loan guarantee effectively serves to provide a backstop to banks and other lenders in case an SME defaults on a loan, lowering a lender’s expected loss and leading to more favourable terms (in comparison to fully unsecured lending), because a lender’s capital at risk is reduced. In general, the bank conducts the due diligence, advances the funds to the business, and if the SME defaults on the loan, the bank claims reimbursement from the government after it has pursued all available security and guarantees.
Examples of federal government loan guarantee programs17 are:
- Canada Small Business Financing Program (CSBFP)
- Canadian Agricultural Loan Act (CALA)18
- Advanced Payments Program (APP)18
- Export Guarantee Program (EGP)
- Trade Expansion Loan Program (TELP)
- Highly Affected Sectors Assistance Program (HASCAP)18
- Softwood Lumber Guarantee Program
- Business Accelerator Loan Program (BALP)
While these programs can be helpful to target certain populations of SMEs, they are a small proportion of a banks’ SME loan portfolio. For instance, in 2024 while there were $67.8 billion in amortizing term loan disbursements, only $1.4 billion was under the CSBFP. Similarly, under the HASCAP $3.7 billion was disbursed between February 2021 and March, 2022 while financial institutions disbursed $74.5 billion in amortized term loans in 2021.
Some of these programs are run through federal financial crown corporations such as Export Development Canada (EDC), the Business Development Bank of Canada (BDC) and Farm Credit Canada (FCC). These crown corporations have different mandates and varying degrees of complementarity to the private sector. The extent of a financial crown corporation’s complementarity in financing markets can be determined by the offering and utilization of programming such as loan guarantees and insurance in partnership with the private sector. For instance:
- EDC is viewed as being highly complementary to the private sector, employing several standard guarantee and insurance programs (e.g. EGP, TELP) that support banks and other lenders to provide financing to exporters
- BDC segments a certain proportion of their lending portfolio for complementary programming, typically during economic slowdowns. Programs include HASCAP during the pandemic and the Softwood Lumber Guarantee Program currently
- Historically, FCC’s partnerships with private sector lenders are mostly limited to large syndicated loans typically beyond the SME market. They are currently running a pilot project for a loan guarantee program with a bank
How SMEs select a lender and their ability to switch lenders
Banks make efforts to create business friendly information about their amortized term loan products on their websites and to support SMEs with trained staff. However, since the key features of pricing, security, and length of term for amortized term loans for SMEs are tailored to business type, business need, business size, level of risk (which is highly variable), availability of government guarantee programs and other factors, there is no standard pricing or loan terms in the industry.
The market study terms of reference indicate that the Competition Bureau will look at whether bundled services – such as business accounts or insurance – limit SMEs’ ability to switch. The concept of "barriers to switching" should not be conflated with the required due diligence required by a bank for SMEs to provide the necessary documentation to pass credit adjudication, anti-money laundering/know‑your‑customer (KYC) checks, and to be onboarded by a new lender. All lenders, bank or non‑bank, and regulated or non‑regulated, will need to conduct due diligence as part of the application for, and before offering an amortized term loan, as all lenders will want to ensure that the SME is a legitimate business with cash flows, assets and a financial plan so that it has the ability to fully repay the debt. If the SME chooses to migrate its deposit accounts, cash management and other payments relationship, this may take some additional time. Lenders have adopted and continue to adopt/improve on processes for efficient onboarding of new customers in order to reduce administrative time involved in switching.
SMEs have ample choice of lenders of all types, and banks compete vigorously for SME business, through targeted small business marketing, industry‑specific product specialists (e.g., for farmers), and through strategic partnerships. Fundamental economic forces can create incentives for an SME to remain with a single primary lender or group of lenders. For example, a lender or bank with multiple products and services may be able to justify additional discounts that are less viable for single‑line products; SMEs may benefit from the convenience of accessing financial products and services in one place; and a deposit account may serve as collateral of an amortized term loan thereby reducing loan costs in addition to creating efficiencies for that SME.
When an SME does seek to switch lenders, it can readily do so by paying out its existing amortized term loan or, if there are prepayment restrictions, by transitioning to a new lender over the term of the existing amortized term loan. Switching between lenders – whether they are banks or non‑banks – may involve certain costs including breakage fees if a fixed rate amortizing term loan is terminated early by the SME borrower, and may also include the costs to transfer a pledge of collateral including discharge fees for the collateral. A breakage fee on a fixed rate amortizing term loan is in effect part of the loan pricing and is designed to compensate the lender for costs incurred as a result of premature termination by the client of a fixed term agreement for which the lender has its own funding costs due to hedging arrangements. Floating rate amortizing term loans do not typically have any type of breakage fee, nor do other forms of open credit (e.g. lines of credit).
SMEs benefit from an ample supply of debt financing including amortizing term loans
SMEs are well served by competition in the financing market. SMEs have access to a broad range of financial solutions, including amortizing term loans, commercial mortgages, leasing, revolving lines of credit, overdraft facilities, credit cards, to venture capital, crowdfunding, and government‑backed programs. Across Canada, according to Statistics Canada, 120 banks, credit unions, caisses populaires, government deposit taking and financial institutions, equipment financing and leasing companies (representing 90 percent of all lending to businesses)19, compete to provide amortizing term loans and other types of financing to SMEs, offering products with a variety of features such as fixed and variable interest rates, short-, medium-, long-term amortization periods, and flexible repayment and prepayment options.20
Highly competitive market for SME debt financing
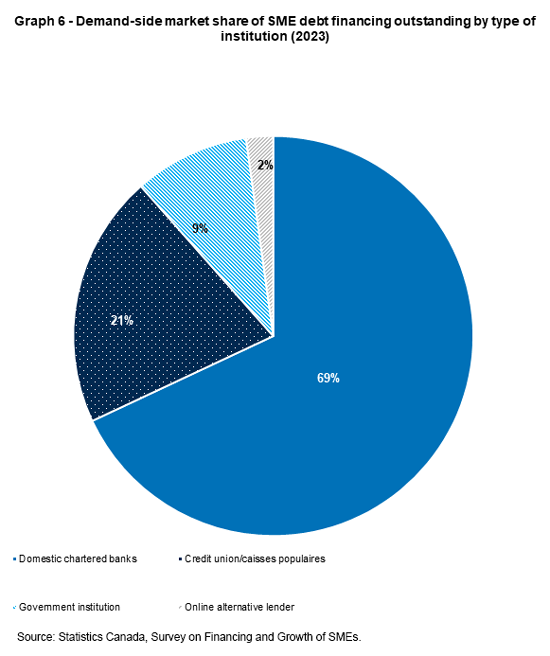
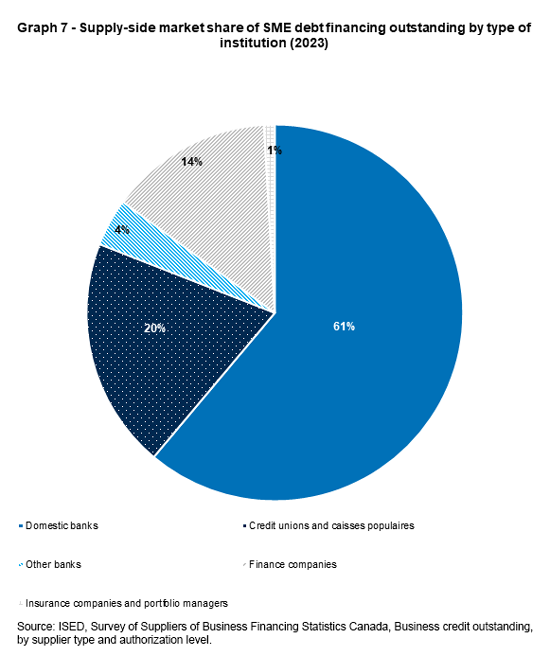
In the SME debt financing marketplace, banks compete against each other and other financial institutions. In 2023, it is estimated that the SME debt market is about $340 billion.21 By looking at both the demand‑side Survey of Financing and Growth of SMEs (Graph 6) and the supply‑side Biannual Survey of Suppliers of Business Financing (Graph 7), banks have provided about two‑thirds of debt outstanding to SMEs, with credit unions and caisses populaires providing about 20 percent of debt outstanding, and finance companies, government institutions, online alternative lenders, insurance companies and portfolio companies providing the remainder. This debt is typically divided between revolving credit and amortizing term credit.
Access to financing is not a primary obstacle to SME growth
In Statistics Canada’s 2023 Survey on Financing and Growth of Small and Medium Enterprises, SMEs consistently cited non-financing factors as the primary obstacles on growth, including rising input costs, corporate tax rates, increased competition, challenges in recruiting and retaining skilled employees, labour shortages, and regulatory burden. Obtaining financing ranks much lower, at tenth overall, as a barrier to growth. Indeed, 60 percent of SMEs stated that obtaining financing was not an obstacle to growth and another 16 percent stated it was only a minor obstacle to growth.22
This perspective that non-financing factors are the primary obstacles to growth is generally shared across different sizes, location, industry types, and age of SMEs. It also has historically been the case. For instance, previous similar surveys conducted by Statistics Canada, obtaining financing consistently ranked among the least likely obstacles to SME growth behind fluctuations in consumer demand, recruiting and retaining skilled employees, rising cost of inputs, government regulation, shortages of labour, maintaining sufficient cash flow or managing debt, and corporate tax rate as major barriers to growth (Table 1).
Table 1: Obstacles to SME growth (2011-2023)
| Ranking of major and moderate obstacles to SME business growth (1=largest obstacle) |
| |
2023 |
2020 |
2017 |
2014 |
2011 |
| Rising cost of inputs |
1 |
1 |
1 |
2 |
1 |
| Corporate tax rate |
2 |
4 |
3 |
6 |
N/A |
| Fluctuations in consumer demand |
3 |
3 |
5 |
1 |
3 |
| Recruiting and retaining skilled employees |
4 |
2 |
4 |
4 |
5 |
| Increasing competition |
5 |
5 |
2 |
3 |
4 |
| Maintaining sufficient cash flow or managing debt |
6 |
7 |
7 |
5 |
2 |
| Shortage of labour |
7 |
6 |
8 |
8 |
7 |
| Transportation costs |
8 |
N/A |
N/A |
N/A |
N/A |
| Government regulations |
9 |
8 |
6 |
N/A |
N/A |
| Obtaining finance |
10 |
9 |
9 |
9 |
9 |
| Difficulty acquiring inputs products or supplies within Canada |
11 |
N/A |
N/A |
N/A |
N/A |
| Difficulty acquiring inputs products or supplies from abroad |
12 |
N/A |
N/A |
N/A |
N/A |
| Logistics management |
13 |
N/A |
N/A |
N/A |
N/A |
| Other |
14 |
10 |
10 |
10 |
8 |
Source: Statistics Canada, Survey of Financing and Growth of SMEs (2011, 2014, 2017, 2020, 2023).
SMEs do not identify bank loan applications as a barrier to financing
The Competition Bureau’s consultation paper cites nearly half of SMEs (49 percent) in Canada as having sought external financing in 2023 from a wide array of options; non-residential mortgage, revolving line of credit, amortizing term loan, credit card, equipment leasing, trade credit, equity financing, government grants, subsidies, guaranteed loans and non‑repayable contributions. Of those SMEs that did not request external financing, the most common reason was that financing was not required (81 percent). Only six per cent cited cost or unawareness of financing sources available to business as the main reasons and only two per cent expected to be declined or cited applying for financing to be too difficult or time consuming.
Table 2: SME Request rate for external financing and main reason for not requesting external financing (2009-2024)
| The main reason small businesses/SMEs did not request external financing |
| Year |
Request rate for external financing (%) |
Financing not needed (%) |
Thought request would be turned down (%) |
Applying for financing is too difficult (%) |
Cost of financing too high (%) |
| 2009 |
16 |
N/A |
N/A |
N/A |
N/A |
| 2010 |
21 |
89 |
3 |
3 |
2 |
| 2011 |
36 |
88 |
3 |
2 |
1 |
| 2012 |
34 |
86 |
4 |
5 |
2 |
| 2013 |
40 |
86 |
3 |
2 |
2 |
| 2014 |
51 |
88 |
2 |
2 |
1 |
| 2015 |
31 |
89 |
3 |
2 |
2 |
| 2016 |
34 |
85 |
4 |
4 |
2 |
| 2017 |
47 |
91 |
1 |
2 |
1 |
| 2018 |
34 |
85 |
4 |
4 |
5 |
| 2019 |
39 |
88 |
2 |
2 |
2 |
| 2020 |
82 |
87 |
3 |
1 |
1 |
| 2021 |
53 |
85 |
4 |
2 |
2 |
| 2022 |
27 |
83 |
3 |
1 |
4 |
| 2023 |
49 |
81 |
2 |
2 |
6 |
| 2024 |
36 |
79 |
1 |
1 |
17 |
Sources: ISED, Credit Conditions Survey (2009, 2010, 2012, 2013, 2015, 2016, 2018, 2019, 2021, 2022, 2024) and Statistics Canada, Credit Conditions SurveySurvey on Financing and Growth of Small and Medium Enterprises (2011, 2014, 2017, 2020, 2023).
Based on 2023 data, the demand for an amortizing term loan grew with the size of the SME. For instance, while only 6 percent of SMEs with 1 to 4 employees requested an amortizing term loan, this grew to 18 percent of large SMEs with 100 to 499 employees.23 Large SMEs have likely scaled (or are scaling) and this growth requires capital investments in equipment, software/IT systems, new premises, etc. Such capital outlays require debt financing support as the business grows. In contrast, SMEs with 1‑4 employees are often at a very nascent stage (or the business is only scaling at the pace that internal cash generation will allow) and thus operations are light in capital equipment, "bootstrapped" or internally supported via equity or retained earnings. It is less common for firms with larger numbers of employee to not have substantial business operations that involve financing Agriculture, forestry and fishing were the most frequent requesters of amortizing term loans with almost one‑in‑five SMEs requesting an amortizing term loan, followed by transportation and warehousing as well as accommodation and food services. These sectors are capital intensive – requiring significant investments in equipment/machinery, fleet (for transportation) and real estate, etc. – and these investments are typically financed via amortizing term loans.
The 2024 Credit Conditions Survey noted that 17 percent of SMEs cited the cost of financing as too high – almost three times as high as the previous year. This is a by‑product of the broader increase in interest rates related to Canadian inflation and monetary policy, following a period of time from the global financial crisis till about 2022 that saw interest rates at historically low levels. In order to fight inflation, starting in 2022, the Bank of Canada rapidly increased and maintained secularly high interest rates which led to increased borrowing costs for borrowers, including SMEs.
Approval rates are high for overall and amortizing term debt
SMEs have benefited from consistently high approval rates for debt financing requests and authorization levels over time. In 2023, the approval rate for debt financing was 88 percent. Taking a longer‑term view, overall SME debt approval rates have remained well above 80 per cent for more than 15 years and well above recessionary levels observed in 2009 (Table 3). It is important to note that the application approval rate will never be 100 percent as that would be a strong indicator of insufficient due diligence and unsustainable debt accumulation.
Table 3: Request, approval and authorized-to-requested rate for SME debt financing
| Year |
Request rate for overall SME debt (%) |
Approval rate for overall SME debt (%) |
Authorized-to-requested ratio for overall SME debt (%) |
| 2009 |
14 |
79 |
72 |
| 2010 |
18 |
88 |
88 |
| 2011 |
25 |
88 |
90 |
| 2012 |
26 |
89 |
90 |
| 2013 |
30 |
85 |
89 |
| 2014 |
28 |
81 |
83 |
| 2015 |
23 |
88 |
90 |
| 2016 |
26 |
82 |
86 |
| 2017 |
26 |
87 |
93 |
| 2018 |
27 |
83 |
88 |
| 2019 |
31 |
89 |
89 |
| 2020 |
82 |
87 |
3 |
| 2021 |
17 |
89 |
93 |
| 2022 |
18 |
88 |
91 |
| 2023 |
25 |
88 |
85 |
| 2024 |
9 |
89 |
91 |
Sources: ISED, Credit Conditions Survey (2009, 2010, 2012, 2013, 2015, 2016, 2018, 2019, 2021, 2022, 2024) and Statistics Canada, Survey on Financing and Growth of Small and Medium Enterprises (2023, 2020, 2017, 2014, 2011).
Approval rates for debt financing in 2023 consistently ranged between 85 and 95 percent no matter the size, region, industry, location, export status, etc. of the SMEs. For instance, SMEs with 1 to 4 employees had an approval rate for debt financing of 87 percent while SMEs with 100 to 499 employees had an approval rate of 93 percent. Similarly, British Columbia and Territories had an approval rate of 85 percent while Quebec had an approval rate of 92 percent. Urban businesses had an approval rate of 88 percent while rural business had an approval rate of 90 percent. Non‑exporters had an approval rate of 88 percent while exporters had a rate of 90 percent.
As it relates to amortizing term debt, specifically, SMEs saw 89 percent of their applications approved in 2023 (Table 4) – higher than lines of credit (80 percent) and non‑residential mortgages (85 percent) and just below credit cards (92 percent). Approval rates for debt financing in 2023 consistently ranged between 80 and 95 percent no matter the size, region, industry, location, export status, etc. of the SMEs. SMEs with 100 to 499 employees had an approval rate for amortizing term loans of 87 percent while SMEs with 20 to 99 employees had an approval rate for amortizing term loans of 95 percent. Similarly, Ontario had an approval rate for amortizing term loans of 79 percent while Saskatchewan had an approval rate for amortizing term loans of 95 percent. Urban businesses had an approval rate for amortizing term loans of 87 percent while rural business had an approval rate of 95 percent. Non‑exporters had an approval rate of 89 percent while exporters had a rate of 90 percent.
Table 4: Request and approval rates for amortizing term loan financing (2011-2023)
| Year |
Request rate for amortizing term loan financing (%) |
Approval rate for amortizing term loan financing (%) |
| 2011 |
N/A |
N/A |
| 2014 |
7 |
86 |
| 2017 |
7 |
91 |
| 2020 |
5 |
89 |
| 2023 |
7 |
89 |
Source: Statistics Canada, Survey on Financing and Growth of Small and Medium Enterprises (2011, 2014, 2017, 2020, 2023).
Consistent with the view that obtaining finance is not an obstacle to growth, a very low percentage of all SMEs have had their debt request denied, due to only a quarter of SMEs applying for debt as well as because a very low percentage of applications were denied – between 8 and 13 percent since 2011. Indeed, in 2023, only 2 percent of the total population of SMEs had a request for debt denied (Table 5).24
Table 5: Proportion of SMEs that debt financing request denied (2011-2023)
| Year |
Of all SMEs, proportion that had their debt request denied (%) |
Of SMEs who applied for debt, proportion that had debt request denied (%) |
| 2011 |
2 |
8 |
| 2014 |
4 |
13 |
| 2017 |
3 |
10 |
| 2020 |
1 |
8 |
| 2023 |
2 |
8 |
Source: Statistics Canada, Survey on Financing and Growth of Small and Medium Enterprises (2023, 2020, 2017, 2014, 2011).
For those SMEs that had their debt financing application denied over the last fifteen years, insufficient sales or cash flow was cited as the primary reason. Insufficient collateral and poor or lack of credit history were cited as the second and third most likely reasons for having a debt request denied (Table 6).
Table 6: Reasons for SME’s debt request to be denied
| Reason for debt request denial |
| Year |
Insufficient sales or cash flow (%) |
Insufficient collateral (%) |
Poor or lack of credit experience or history (%) |
Project was considered too risky (%) |
Business operates in an unstable industry (%) |
| 2011 |
36 |
48 |
21 |
37 |
31 |
| 2014 |
35 |
30 |
22 |
27 |
20 |
| 2017 |
41 |
32 |
28 |
29 |
17 |
| 2020 |
34 |
9 |
26 |
8 |
13 |
| 2023 |
37 |
22 |
20 |
7 |
7 |
Source: Statistics Canada, Survey on Financing and Growth of Small and Medium Enterprises (2023, 2020, 2017, 2014, 2011).
Collateral is often required for SME debt financing
Collateral is an asset that is pledged by a borrower to a lender and is often an important part of a lender’s due diligence during a loan adjudication. If a borrower defaults on the loan obligation, the lender has the right to seize the collateral if the borrower defaults on the obligation. Collateral can serve to enable lending by reducing the risk for a lender that they will not be made whole from a loan.
Since 2009, collateral is required from roughly one-half to two-thirds of SMEs applying for debt financing. This collateral usually entails business or personal assets.
| Proportion of SME debt financing requiring collateral (%) |
| 2009 |
2010 |
2011 |
2012 |
2013 |
2014 |
2015 |
2016 |
2017 |
2018 |
2019 |
2020 |
2021 |
2022 |
2023 |
2024 |
| 56 |
67 |
64 |
76 |
60 |
65 |
82 |
63 |
64 |
55 |
63 |
62 |
58 |
62 |
46 |
66 |
Sources: ISED, Credit Conditions Survey (2009, 2010, 2012, 2013, 2015, 2016, 2018, 2019, 2021, 2022, 2024) and Statistics Canada, Survey on Financing and Growth of Small and Medium Enterprises (2011, 2014, 2017, 2020, 2023).
Financing day‑to‑day obligations is the primary use of SME debt financing
In 2023, the majority of SMEs (59 percent) that sought debt financing intended to use it to support day-to-day operations, including inventory purchases, supplier payments, and salaries. Other common purposes were machinery or equipment purchases (20 percent), vehicles or rolling stock (16 percent), debt consolidation or payments (16 percent), and land and buildings (12 percent).
| Intended use of SME debt financing 2023 (%) |
| Working capital and operating capital for inventory, paying suppliers, salaries, or other obligations |
59 |
| Other machinery or equipment |
20 |
| Vehicles or rolling stock |
16 |
| Debt consolidation or payments |
13 |
| Land and buildings |
12 |
| Computer hardware |
11 |
| Computer software |
9 |
| Research and development |
3 |
| Digital and tech investments |
5 |
| Purchase a business |
3 |
| Other purpose |
3 |
| To enter a new market |
3 |
| Reducing carbon footprint |
1 |
Source: Statistics Canada, Survey of Financing and Growth of SMEs (2023).
Across practically all categories related to size, region, industry, location, export status, etc. of the SMEs, working capital and operating capital for inventory, paying suppliers, salaries, or other obligations were the primary reasons for seeking debt financing. This intended use is best served with revolving credit facilities such as revolving lines of credit and credit cards rather than amortizing term loans.
Amortizing term loans tend to be more helpful for financing fixed asset purchases such as machinery and equipment, land and buildings, and computer hardware. These assets can be used as collateral and financed over the useful life and value of the asset.
Pricing of amortizing term loans based on business risk
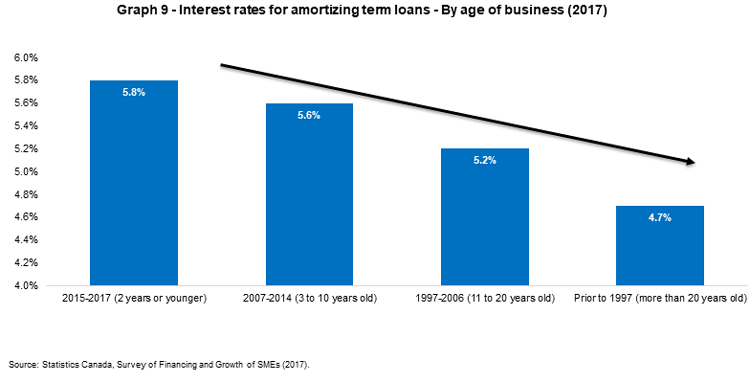
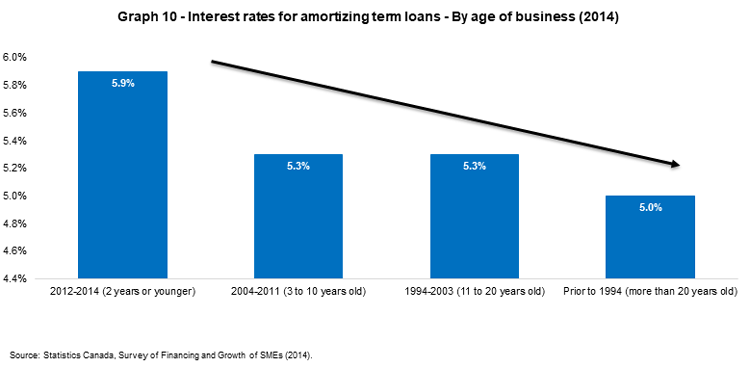
Banks price financing, including amortizing term loans, based on both the amount of risk posed by the business as well as the particulars details of the transaction (e.g. collateral, loan‑to‑value, guarantees, etc.). The newer, more inexperienced the business, the greater the likelihood that the business will face higher costs to access amortizing term loans due to insufficient sales or cash‑flow, higher loan default risk, shorter credit histories and track records, inadequate collateral, and greater year‑to‑year fluctuations in sales and earnings.
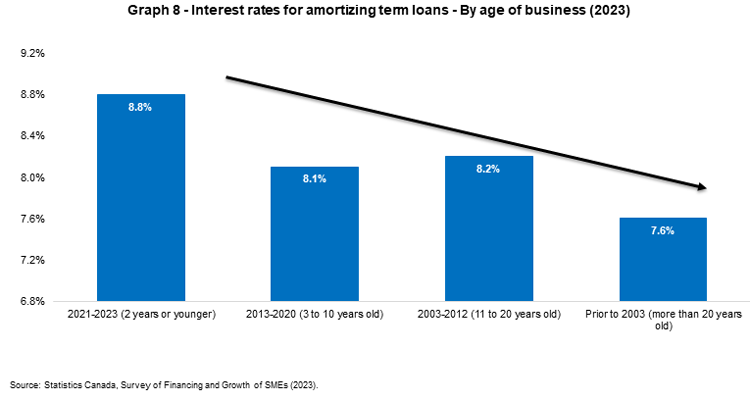
This can be seen over three different surveys over the past decade. In Statistics Canada’s Survey of Financing and Growth of SMEs in 2023, 2017 and 2014, the newest businesses (2 years or younger) had the highest interest rates for amortizing term loans. Alternatively, those businesses that had been operating for more than 20 years had the lowest interest rates for amortizing terms loans (Graphs 8, 9 & 10). The difference in interest rates between the newest and oldest cohorts of SMEs was roughly 1 percent.
Neither the size nor the location of the business is as strong a factor in the pricing of amortizing term loans. For instance, in 2023, small businesses with 1‑4 employees saw the interest rate for amortizing term loans cost 5.3 percent while small businesses with 5‑19 employees saw a higher interest rate for amortizing term loans of 5.5 percent. Similarly, SMEs in urban and rural locations had nearly identical interest rates of 5.3 percent and 5.2 percent, respectively.
International risk premium comparisons are constrained by inconsistent methodologies and definitions
The Competition Bureau’s consultation paper cited the 2024 OECD Financing SMEs and Entrepreneurs Scoreboard to suggest that Canadian SMEs face disadvantageous loan pricing conditions for SMEs through larger risk premiums than their peers in other OECD countries. We caution against the use of OECD data for international comparisons as it relies on national statistical agencies that have different methodological approaches and definitions. Indeed, the OECD itself states that: the cross‑country comparability of national surveys remains limited, as survey methodologies and the target population differ from country to country.25
As it relates to international comparisons of interest rates for businesses, the CBA has come across several problems. Firstly, countries have used different definitions of SME. Looking at the four most comparable markets to Canada – the U.S., the U.K., Australia and New Zealand – there is not one common definition of SME. Canada defines SME as 1 to 99 employees,26 whereas Australia defines SME as any business with sales less than 50 million AUD and the U.K defines SME as any business with sales less than 25 million GBP. In comparison, Statistics Canada suggests that the average sales for a small business in 2022 was around $500,000.27 While New Zealand has a definition of a small business of 1 million NZD which is most closest to that of Canada’s definition, not only do they estimate an interest rate for small business loans of 11.5 percent in 2022 (Canadian small business had an interest rate of 5.5 percent), a differential could not be calculated as data is missing for interest rates for large businesses. Similarly, for the U.S., a differential could not be calculated as data is missing for interest rates for large businesses. Lastly, while the OECD suggests that the interest rate for large loans should be the average annual rate for new loans, base rate for loans equal to or greater than EUR 1 million, for maturity less than one year.28 It is unclear how this is to be applied in the Canadian context (or any other context outside of Europe) as ISED appears to assume the prime rate is the average interest rate for large firms. Loans for large corporations have significant variances for companies of similar size that are based on various risk and capital factors, specifically borrower risk rating, assets being financed, and security over the assets.
Recommendations
Ease the burdens for entry and growth of institutions in the banking system without compromising stability and consumer protection
The process for becoming or expanding a small and medium sized bank (SMSB) or a federal credit union should be less burdensome and more transparent without compromising the stability of Canada’s financial system and consumer protection. Both the Department of Finance and OSFI have acknowledged the need to improve this process. In the 2025 Budget, the federal government committed to amend the Bank Act and the Canada Deposit Insurance Corporation Act to make it easier for federal credit unions to achieve scale and for provincial credit unions to enter the federal framework. Once the Budget Implementation Act, currently before Parliament, is passed and the changes come into effect, legislative requirements at a federal level for federal credit unions to grow by amalgamation or asset acquisition will be eased.
The Budget Implementation Act also proposes to amend the Bank Act, Trust and Loan Companies Act and Insurance Companies Act to raise the equity threshold for the 35 percent public holding requirement from $2 billion to $4 billion (allowing small financial institutions to grow larger before having to change their ownership structure). OSFI has also committed to revamping their approvals process to facilitate entry for banks and federal credit unions, improve overall approval times and, with that, mature their tolerance for risk. They also committed to find opportunities for clearer, more predictable and timely approval of new entrants to the banking sector.29 OSFI has recently stated that it intends to launch a pilot for the fast‑track framework in June 2026 with a focus on prioritizing structured, risk-based reviews, with earlier identification of issues, and clear service standards. Their focus will be on credit unions and entities with technologically innovative or emerging banking models, such as fintechs and crypto custodians. Lessons from the pilot are expected to shape a broader rollout.30
For the federal credit union option, assistance is needed provincially as well. Most provincial legislation is silent on a credit union’s continuance under the Bank Act, an option for credit unions to operate under the national standard or amalgamate with an existing federal credit union.31 The limited number of transitions to date highlights persistent internal regulatory barriers, and that greater transition flexibility is needed to allow credit unions to scale and compete across provinces. Provinces should ensure a smooth and efficient process for provincial credit unions to transition to the federal level as stand alone or amalgamated entities. They also need to ensure that requirements (including approvals) are proportionate to the transaction; they should provide guidance that facilitates credit unions’ continuance under the federal Bank Act following an amalgamation or asset transaction between federal and provincial credit unions.
Respect the principle of proportionality for small- and medium‑sized banks
Once SMSBs and federal credit unions are operating, they must be given the opportunity to thrive. It is widely understood that the cost of regulation is scale dependent, and therefore an efficient regulatory system needs to have an element of proportionality embedded into it to ensure that it fosters competition. Research conducted by the C.D. Howe Institute showed that financial sector compliance burdens are rising sharply, with significant implications for firms’ competitiveness. The Compliance Labour Cost Index, which tracks regulatory labour across the sector, reveals that compliance demands grew from 16 percent of total internal labour in 2019 to 21 percent in 2024. This is particularly acute for smaller firms, where compliance costs reached 28 percent of payroll – double the share borne by larger institutions. External compliance expenses, including advisory, technology, and governance costs, have also grown, further restricting firms’ ability to invest in growth and innovation.32
When done effectively, a proportional framework would allow small- and medium‑sized banks to grow into the level of prudential regulation that suits their overall level of significance or risk to the economy and their level of complexity.
In 2022, OSFI introduced a proportional regulatory framework to give effect to this principle in the prudential regulatory space. While this was welcomed by the industry, SMSBs are concerned that more recently the Government’s overall commitment to the principle of proportionality has been wavering. While it is generally recognized that regulation needs to evolve as circumstances change, the principle of proportionality needs to remain embedded in the regulatory system.
Such a framework would address capital, liquidity, leverage ratio requirements, as well as requirements associated with new and emerging risks, and supervisory oversight. It should also strive to ensure that SMSBs can compete effectively while maintaining acceptable risk parameters that are set by the regulator.
Furthermore, this commitment to a proportional regulatory framework is particularly relevant in the current environment as OSFI implements its Supervisory Framework Renewal, which is transforming the manner in which the regulator reviews and engages with regulated financial institutions. We recommend that OSFI conducts a periodic self assessment of its proportional framework, with input from industry, to track progress on ensuring that its regulatory framework is striking the right balance between maintaining safety while enabling effective competition.
Implement changes to bank capital adequacy frameworks that enable the deployment of more capital
Budget 2025 noted that OSFI has recently announced a number of steps to provide clarity in capital planning for Canada’s regulated financial institutions through engagement with SMSBs about changes to capital requirements33 as well as consulting on ways to encourage business lending by banks in support of the economy through the capital treatment of certain types of loans. Research from the Banque de France revealed that similar measures employed in Europe more than ten years ago to reduce the risk weight on SME lending had a positive effect on the level and price of credit available to small businesses.34
The CBA views the steps announced in the Budget as important. We welcome positive changes that OSFI has already proposed in its 2027 CAR Guideline consultation such as lowering the risk weight applied to Corporate SME exposures under the Credit Risk Standardized Approach to 75 percent from 85 percent. Such capital changes are a move in the right direction to bring the standardized risk weights for SMSBs more into line with the more empirically‑based advanced internal risk based (AIRB) risk weights, which are used by banks with OSFI‑approved models. It is the CBA’s view that where the differential between AIRB risk weights and standardized weights are excessive, the standardized weight, which is arbitrary, should be reduced to a level closer to the AIRB weight, which is calculated based on actual Canadian data. It is important to ensure that the fundamental principle of risk sensitivity exists throughout the capital framework such that risk weights reflect actual historical loss experience and do not create a barrier to lending. Excessive differences between standardized and AIRB risk weights have the effect of concentrating the business of standardized banks into a limited set of asset classes, which is problematic from a competitive perspective and also from a financial stability perspective.
There are additional changes that can be made to banks’ capital adequacy frameworks that would reduce the level of capital that lenders need to hold to support SME lending and enable the deployment of more capital for SMEs. For instance, a SME Support Factor to AIRB risk weighted assets for corporate SME exposures could be applied similar to what is done in other major jurisdictions outside of Canada to ensure that larger banks are also encouraged to continue supporting the sector. Similarly, the definition of retail small business entities (SBE) exposures could be increased to a higher amount and adjusted for inflation annually going forward. Alternatively, a revenue‑based metric could be used to determine retail SBE eligibility. Lastly, support could be provided for the Canadian venture capital companies by reducing the risk weight on minority equity investments in Canadian venture companies or funds that invest in majority Canadian venture companies. This would encourage Canadian banks to provide more funding to support the Canadian venture capital (VC) eco-system, which would in turn help attract high‑potential Canadian start‑ups to stay in Canada as opposed to moving to other jurisdictions like the U.S.
Strengthening coordination and incorporate growth considerations into regulatory decision-making
While the core focus of financial sector prudential regulation will always be safety and soundness, there is a growing recognition that prudential regulation impacts economic growth, and that impact needs to be factored into regulatory decision‑making. Governments in other jurisdictions have publicly highlighted this relationship and taken steps to reflect the growth imperative in the regulatory decision‑making process, and have complemented that with cost‑benefit and post‑implementation impact analyses to determine whether the right balance was struck.
Budget 2025 recently announced the government’s intention to make federal financial sector consultations more predictable and transparent for stakeholders through better coordination and communication among federal financial regulators and the Department of Finance Canada and by sharing how the potential impacts of new requirements have been considered. This is a positive step given Statistics Canada identified the financial services sector as the sector with the third highest annual growth in the number of regulatory requirements between 2006 and 2021 among thirteen sectors.35
In terms of making financial sector consultations more predictable and transparent, initiatives such as the Regulatory Initiatives Grid (RIG) in the U.K. and Australia have encouraged regulators to coordinate, align and communicate to a greater extent. In these cases, regulatory consultations and implementation schedules (amongst all the policy makers and regulators) are disclosed, coordinated, prioritized and appropriately staged over the next couple of years. This enables banks and other financial institutions to provide views, plan and implement the highest priority regulatory proposals while supporting pro‑competitive outcomes based on a "whole‑of‑government" approach.
In terms of how potential impacts of new requirements have been considered, one way to do this is for the federal government to consider implementing cost‑benefit and post‑implementation impact analyses at the Department of Finance, along with its federal financial regulatory partners (OSFI, CDIC, FCAC, Bank of Canada, and FINTRAC) to determine whether regulatory measures are properly calibrated relative to their impact on economic growth. Federal financial regulatory partners should also consider working with their provincial counterparts to design a consistent and coordinated approach to such analyses of financial regulation.
Streamline and improve government guarantee programs, notably the CSBFP
There is an opportunity to streamline and improve the federal government’s guarantee programs. Ideally, there would be fewer, more flexible and simplified programs rather than a multiplicity of government guarantee programs that require a heightened level of administrative knowledge and increased operational complexity. The number of discrete government guarantee programs has increased greatly through and post‑COVID and continues to grow. This dilutes effectiveness in mobilizing banks’ distribution power to bring these programs to clients. The cumulative costs of maintenance, training, and reporting of each of these individual programs can also be a disincentive to their usage. This is why we are generally supportive of the proposal in the 2025 federal Budget to transition the administration of the CSBFP from ISED to the BDC. Such a move to the BDC provides an opportunity to make the CSBFP more nimble and flexible.
When moving the CSBFP to the BDC, there are opportunities where the Program can be improved upon to serve a greater population of SMEs. They are:
- Borrower‑centric origination process – The current Program has complex guidelines and administration requirements including highly specific elements around client documentation and types of costs which make it difficult for banks’ relationship managers to communicate requirements and provide support to clients
- Increase the maximum loan amount - Further increases in maximum loan amounts, particularly for real property and equipment financing, due to higher real estate prices and inflation as well as for intangible assets such as research and development and intellectual property
- Expand eligible borrowers - Permit assets, such as real estate, to be held within non‑arms length holding companies. This structure allows banks to perfect security while ensuring operating companies continue to guarantee owner‑occupied properties
- Enhance acquisition financing - Developing a framework to support succession planning for long‑standing, successful business owners
- Improve the claims process – The current claims process is slow due partly because of the requirements to complete the pursuit of personal guarantors and extended back‑and‑forth on immaterial items
- Initiate information sharing - Share data with lenders on liability and potential improprieties (e.g., statistics in quarterly reports sent to lenders in the Program)
- Minister's Liability - Increase or remove the Minister’s Liability of $1.5 billion over each five‑year lending period to reflect increase loan amounts and total aggregate credit extended
Similarly, there are opportunities to apply some of these suggestions to other government loan guarantee programs. For instance, the CALA’s maximum loan guarantee amounts for real property ($500,000) and other purposes ($350,000) are insufficient to meet customer needs, particularly in a capital intensive sector such as agriculture.
Expand data sharing policy to include government entities such as the CRA
The federal government has prioritized data sharing in order to provide Canadians greater control over their data while promoting a competitive and innovative financial sector that strengthens Canada's position in the global digital economy. While the focus of this data sharing has been on private sector entities, there is an opportunity for the federal government to share some of its data to increase productivity in the economy through the secure sharing of taxpayer information from the Canada Revenue Agency (CRA) with banks and other financial institutions with the appropriate consents.
For businesses, when lenders undertake a due diligence process when underwriting a loan, lenders must verify information through borrower‑provided documentation in order to determine the credit worthiness of such borrowers. For SMEs, these documents include tax‑related documents such as the notice of assessment/T1 General, Statement of Business Activity, HST/GST returns, EI/CPP contributions, as well as T2 Forms. This process can be quite cumbersome often requiring business owners to look for, sort through and share paper documents with their lender and may need to be repeated to fulfill ongoing monitoring requirements on an annual basis. This process can be improved through the digital sharing of information directly from the true source.
There is an opportunity for the federal government to expand its data sharing efforts to include government entities such as the CRA. This would enable lenders to obtain data necessary for their due diligence requirements from the source of truth, while sparing the time and efforts of borrowers to repeat production and collection of such records.
Conclusion
SMEs are a critical pillar of the Canadian economy. Banks compete aggressively with one another as well as non‑bank financial institutions and companies to serve SMEs and provide financing, including amortizing term loans.
It is from this perspective that the CBA is pleased to have provided its submission to the Competition Bureau for its study of competition in the financing of Canada’s small and medium‑sized enterprises. Our submission covers the banking sector’s perspective on the study’s main questions around the state of competition in SME financing, barriers lenders face when they try to enter the market or grow, and how these barriers can be reduced and factors relating to switching lenders.
The submission also makes a number of recommendations in order to remove friction for SMEs and increase competition in the financial services marketplace.
Thank you for the opportunity to share our comments. We are happy to meet with the Bureau to further discuss our submission if you have any questions.
Appendix 1 – Federal government guarantee programs
| Program |
Administrator |
Mandate |
Key Program Features |
| Canada Small Business Financing Program (CSBFP) |
Current: Innovation, Science, and Economic Development (ISED) |
Designed to help businesses with their financing needs by helping to fill gaps in the lending market for certain types of small- and medium‑sized enterprises (SMEs) |
- Government guarantee up to 85 percent of the loan
- Maximum term loan financing of $1 million of which a maximum of $500,000 is for a purpose other than the purchase and improvement of real property of which the borrower is or will become the owner
- Within the maximum limit of $500,000 mentioned above for leasehold improvements and equipment, a maximum of $150,000 can be used to finance intangible assets and working capital costs
- Total loan is $1.15 million - $1 million for an amortizing term loan and $150,000 for line of credit
- Financing classes include real property, equipment, computer software and working capital costs
|
| Canadian Agricultural Loan Act Program (CALA) |
Agriculture and Agri‑Food Canada (AAFC) |
Designed to increase the availability of loans to farmers and agricultural co‑operatives. Farmers can use these loans to establish, improve, and develop farms, while agricultural co‑operatives may also access loans to process, distribute, or market the products of farming |
- Government guarantee up to 95 percent of the loan
- Maximum loan for any one farm operation is $500,000
- Maximum loan for land purchase or construction or building improvements is $500,000 and $350,000 for all other loan purposes
- Amortization up to 5 years for terms of 15 years for land and 10 years for all other Agri‑business
- Maximum aggregate loan for agricultural co‑operatives is $3 million
|
| Advanced Payments Program (APP) |
Agriculture and Agri‑Food Canada (AAFC) |
Designed to provide agricultural producers with easy access to low‑cost cash advances |
- Available through participating producer organizations (i.e., APP administrators)
- Provides for up to 18 months (24 months for cattle and bison) of financing for over 4,000 different commodities
- Eligible companies can receive up to $250,000 and $100,000 in 2025 and 2026, respectively, interest free, with an additional $750,000 or $900,000 at the prime interest rate for a maximum of $1 million
- Calculated based on up to 50% of the anticipated market value of eligible agricultural products
- Requires security for an advance
|
| Export Guarantee Program |
Export Development Canada (EDC) |
Designed to advance loans to smaller exporters by providing additional security |
- Applied to both operating lines and term loans
- Maximum coverage is US$25 million under one or multiple EGP guarantees
- Fees based on credit rating and amount of financing needed
|
| Trade Expansion Loan Program (TELP) |
Export Development Canada (EDC) |
Provides loan guarantees to lenders to encourage extending credit to SMEs looking to export |
- Covers a wide range of export‑related expenses, including market entry costs, logistics, and working capital
- Offers guarantees of up to 100% of the loan amount
- Guarantees working capital up to $13.3 million
|
| Highly Affected Sectors Assistance Program (HASCAP) |
Business Development Bank of Canada (BDC) |
Temporary program designed to provide guaranteed, low interest, loans to Canadian small businesses heavily impacted by COVID‑19; part of Government of Canada Business Credit Availability Program (BCAP) |
- Government guarantee of 100 percent
- SMEs that saw revenues decrease by 50% or more due to COVID
- Loan amounts range from $25,000 to $1 million to cover operational cash flow needs
- Interest rate of 4%, repayment term of up to 10 years
- 12-month postponement of principal payment at the start of the loan
|
| Softwood Lumber Guarantee Program |
Business Development Bank of Canada (BDC) |
Designed to help sawmills, lumbermills, and remanufactures access financing through their existing financial institutions by guaranteeing term loans and letters of credit |
- Loans from $500,000 to $30 million per eligible borrower group
- Minimum annual revenue of $1 million
|
| Business Accelerator Loan Program (BALP) |
Business Development Bank of Canada (BDC) |
Designed to help entrepreneurs get needed financing for working capital |
- For existing operating businesses with revenues of less than $10 million
- Loan amounts between $25,000 and $500,000 for working capital
|
Appendix 2 – Selected data for loan guarantee programs
Canada Small Business Financing Program (CSBFP)
Percentage distribution of CSBFP borrowers (2019‑24) versus Canadian SME population by region (2023)
| Region |
Percentage of Total CSBFP Borrowers (2014-19) (%) |
Percentage of Total Canadian SMEs (2023) (%) |
| Newfoundland and Labrador |
0.5 |
1.4 |
| Prince Edward Island |
0.3 |
0.5 |
| Nova Scotia |
1.9 |
2.4 |
| New Brunswick |
2.3 |
2.0 |
| Quebec |
20.1 |
20.6 |
| Ontario |
41.5 |
37.5 |
| Manitoba |
2.6 |
3.2 |
| Saskatchewan |
4.6 |
3.2 |
| Alberta |
16.6 |
13.0 |
| British Columbia |
9.5 |
15.9 |
| Yukon |
0.0 |
0.1 |
| Northwest Territories |
0.0 |
0.1 |
| Nunavut |
0.0 |
0.1 |
Source: Canada Small Business Financing Act Comprehensive Review Report 2019‑2024, February 10, 2025.
Number and value of CSBFP loans, 2019‑2025
| Year |
Value of Loans (in $ millions) |
Number of loans |
| 2019-20 |
1,300.4 |
5,746 |
| 2020-21 |
875.1 |
3,739 |
| 2021-22 |
1,232.2 |
5,075 |
| 2022-23 |
1,489.4 |
5,591 |
| 2023-24 |
1,772.1 |
6,238 |
| 2024-25 |
1,446.7 |
4,883 |
Source: Canada Small Business Financing Act Comprehensive Review Report 2019‑2024, February 10, 2025 and ISED data.
Canadian Agriculture Loans Act (CALA)
Number and value of CALA loans, 2019-2023
| Year |
Value of Loans (in $ millions) |
Number of loans |
| 2019-20 |
72.7 |
853 |
| 2020-21 |
68.5 |
771 |
| 2021-22 |
51.3 |
517 |
| 2022-23 |
39.7 |
417 |
Source: AAFC, Evaluation of the Canadian Agricultural Loans Act Program.
Advancement Payments Program (APP)
Value of APP loans outstanding, 2019-2024
| Year |
Value of Loans (in $ millions) |
| 2019 |
2,749.2 |
| 2020 |
2,243.3 |
| 2021 |
1,830.0 |
| 2022 |
2,675.7 |
| 2023 |
3,344.2 |
| 2024 |
3,213.1 |
Source: Statistics Canada, Farm Debt Outstanding.
Highly Affected Sectors Assistance Program (HASCAP)
Location of HASCAP recipients
| Region |
% |
| Atlantic |
2.4 |
| Quebec |
15.1 |
| Ontario |
52.3 |
| Manitoba |
1.6 |
| Saskatchewan |
0.9 |
| Alberta |
18.9 |
| British Columbia |
8.7 |
Source: ISED, The impact of the Highly Affected Sectors Credit Availability Program on business closure and growth: Evidence from the 2020 COVID-19 pandemic.
1 Amortizing means to reduce or pay off a debt with regular payments of principal and interest. In comparison, revolving debt means that only interest needs to be paid regularly
2 All banks except for foreign bank branches are members of the Canadian Deposit Insurance Corporation (CDIC) and are regulated for market conduct by the Financial Consumer Agency of Canada (FCAC).
3 This is the most recent data available.
4 There is also little evidence of a strong relationship between the concentration of a country’s banking system and its productivity growth. For example, OECD data on average annual labour productivity growth over the past decade show that France, Italy, and Austria experienced lower productivity growth despite having lower large-bank asset concentration than Canada. Conversely, Germany, Netherlands, and Denmark recorded higher productivity growth while also exhibiting higher large-bank concentration ratios than Canada.
5 Tracxn, Fintech Startups in Canada, February 2026.
6 2025 Evident AI Index.
7 Edelman Canada, 2024 Edelman Trust Barometer Supplemental Report: Insights for Financial Services in Canada, 2024.
8 Other payment structures such as flexible payments, irregular payments, seasonal, quarterly, semi-annual do exist in order to align with the cash flow of the borrower (e.g. cash crop agriculture and fishery borrowers may only have one annual principal payment). Monthly payments are the most common frequency of payment, and even where the principal payment is not monthly the interest payment may still be monthly in many cases.
9 For example, prepayment amounts can be for 10 percent of the loan with larger prepayments subject to breakage fees to compensate lenders for the impact on their funding costs.
10 Financial covenants and additional terms and conditions may be applicable depending on the nature of the transaction. Smaller businesses are rarely asked for covenants, however, a personal guarantee from the shareholder(s) is required for most transactions.
11 Banks consider any derogatory information relating to payments – collection items, write‑off history, etc. They also reference court orders and garnishments when it comes to the character of the borrower. In the small business space, the personal creditworthiness of the business owner is critical, based on bureau pulls and personal guarantees.
12 OSFI CAR Guidelines require an assessment of personal exposure to determine capital treatment.
13 World Intellectual Property Organization (WIPO) & Canadian Intellectual Property Office (CIPO), Country Perspectives: World Intellectual Property Organization.
14 Bank of Canada, Business Outlook Survey - Fourth Quarter of 2024.
15 Bank of Canada, Business Outlook Survey - Fourth Quarter of 2024.
16 Some of these programs operate throughout a business cycle while others are in response to temporary external macroeconomic events such as the global financial crisis or the COVID‑19 pandemic.
17 Elaboration of these programs can be found in Appendix 1.
18 Statistical breakdown of the CSBFP, CALA, APP, and HASCAP can be found in Appendix 2.
19 ISED Biannual Survey of Suppliers of Business Financing.
20 To better understand SME access to capital, three datasets in Canada offer complementary perspectives on the lending market: the demand‑side Statistics Canada Survey on Financing and Growth of Small and Medium Enterprises (which captures all SMEs) and Innovation, Science and Economic Development (ISED) Small Business Credit Conditions Survey (which captures just small businesses) (collectively, the "demand‑side surveys" and the supply‑side ISED Biannual Survey of Suppliers of Business Financing Provider of Debt Financing for SMEs (which captures all SMEs) (the "supply‑side survey"). The demand‑side surveys SMEs themselves and define small businesses and medium‑sized businesses as those with 1 to 99 and 100 to 499 employees, respectively. The supply‑side survey covers financial institutions which define small businesses and medium‑sized businesses as those with loan authorizations under $999,999 and $1,000,000 to $4,999,999 in loan authorizations, respectively. Additional differences include reporting periods and metrics reported. While the 2024 Credit Conditions Survey is the most recent survey, the CBA often quotes the 2023 Survey of Financing and Growth of Small and Medium Enterprises in this submission due to the breadth and depth of the SME data. Secondary sources of data are the Bank of Canada’s Business Outlook Survey (BOS) which relies on employee‑based definitions as well as the CBA’s Business Credit data which relies on the size of loan authorizations definition. Collectively, these surveys enable stakeholders to assess lending market conditions in the SME market.
21 Statistics Canada. Table 33‑10‑0013‑01 Business credit outstanding, by supplier type and authorization level.
22 Statistics Canada, Survey of Financing and Growth of Small and Medium‑Sized Enterprises (2023).
23 According to ISED’s Key Small Business Statistics, in December 2024, 98.2 percent of businesses in Canada have 1-99 employees, while 1.5 percent of businesses have 100-499 employees and 0.3 percent of businesses have 500 and over employees.
24 With 25 percent of SMEs applying for debt financing and only 8 percent of SMEs in this subset had their debt request denied, meaning 2 percent of the total SME population had their debt request denied.
25 2024 OECD Financing SMEs and Entrepreneurs Scoreboard, p. 228.
26 The OECD is utilizing ISED’s 2021 and 2022 Credit Conditions Survey which only surveys small business with 1 to 99 employees.
27 Statistics Canada, Small and medium‑sized business in rural and small town Canada, 2022.
28 2024 OECD Financing SMEs and Entrepreneurs Scoreboard, p. 229.
29 Speech by Peter Routledge, Superintendent of Financial Institutions, Global Risk Institute Summit 2025, Toronto - September 17, 2025.
30 Remarks by Peter Routledge, Superintendent of Financial Institutions, TD Annual Conference, Toronto – January 30, 2026.
31 Currently, Alberta and New Brunswick have legislation that explicitly contemplates the amalgamation of a provincially regulated credit union with a federally regulated credit union under federal continuance.
32 C.D. Howe Institute, Pruning the Rulebook: Canada’s Financial Regulatory Scorecard, Year Two, October 16, 2025.
33 OSFI 2027 Draft Capital Adequacy Requirements (CAR) Guideline (2027) consultations propose to lower the risk weight applied to Corporate SME exposures under the credit risk SA to 75 percent from 85 percent, regardless of whether they meet the criteria for regulatory retail. Furthermore, OSFI is proposing to lower the risk weight under the credit risk SA for unrated exposures to Corporates that qualify as "investment grade" from 150 percent to 135 percent.
34 Banque de France, Lower capital requirements as a policy tool to support credit to SMEs: Evidence from a policy experiment.
35 Wulong Gu, Regulatory Accumulation, Business Dynamism and Economic Growth in Canada, Statistics Canada, February 10, 2025.